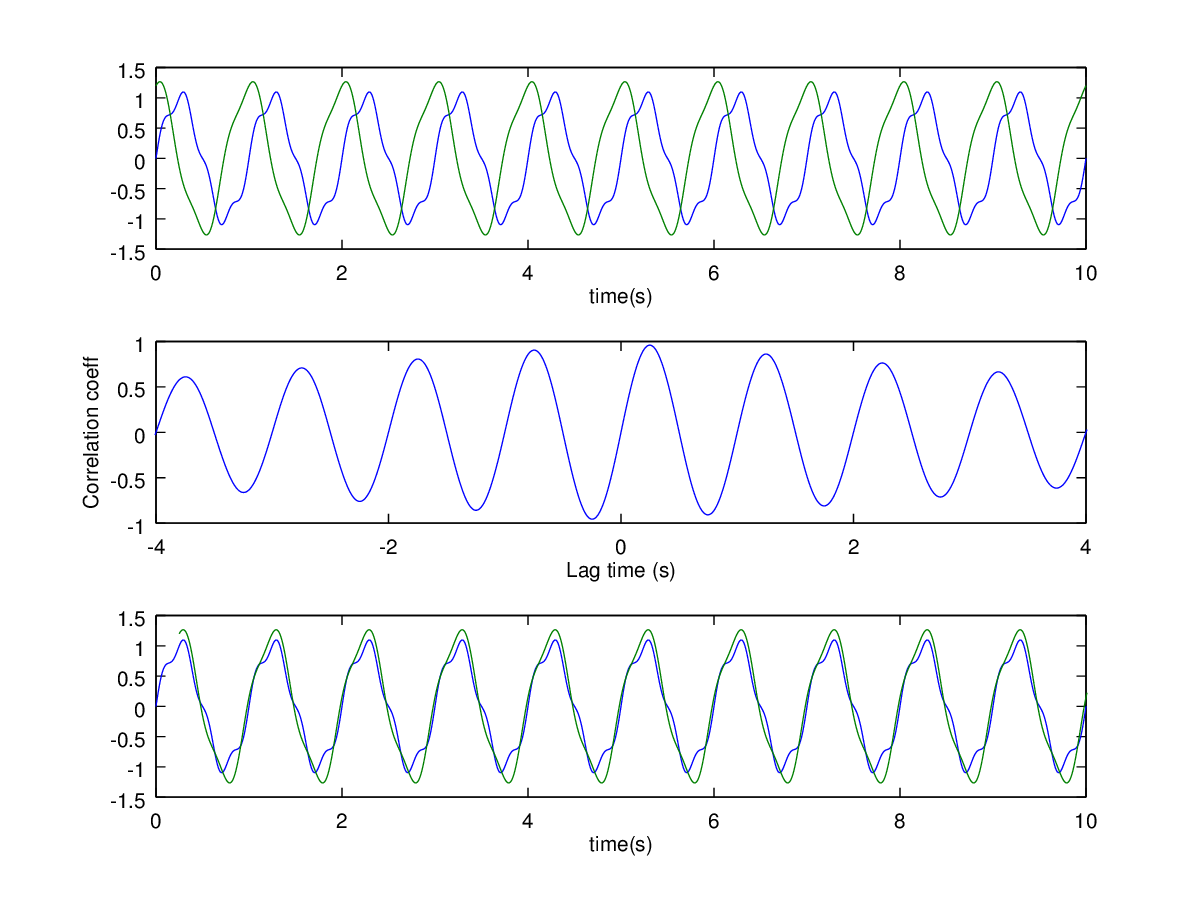
Consider as an example the top plot in Figure 10. We have two periodic signals. They don't have quite the same amplitude, and there are some higher harmonics on each, but they have the same fundamental period. Let's say that we want to line them up so that they are in phase with each other. How would we do that?
You could try to just plot the signals with various time lags (e.g. plot(t,sig1,t+delta,sig2)). By trial and error you could eventually determine what value of delta is ``the best''. But that may take awhile. A better answer is to use cross-correlation, which will basically try every single possible time shift for you, and let you know which one makes the peaks and valleys line up the best. The middle plot shows the result of the xcorr() function. The x-axis is a time lag by which one signal is shifted, and the y-axis is the correlation between them at that shift. The highest correlation is obtained at a shift of 0.25s. In the bottom plot, the green line is shifted forward by 0.25s. This lines the graphs up perfectly. The code used to generate the graph is below. Note that we are finding the maximum value of the correlation and computing the necessary phase shift automatically.
Note: there's a fairly confusing point here regarding the difference between correlation and convolution. The two operations are very similar. In both cases, one vector shifts or slides along another vector. The difference is that in convolution, one vector is time reversed first. This movie illustrates it fairly well https://www.youtube.com/watch?v=Ma0YONjMZLIhttps://www.youtube.com/watch?v=Ma0YONjMZLI. In matlab terms, conv(sig1, sig2) = xcorr( sig1, sig2(end:-1:1)). Convolution is pretty useful in vibration analysis and signal processing. However, for the purpose of this section, lining up two periodic signals, correlation is the one we want.
Fs = 100;
t = 0:(1/Fs):10;
f = 1;
%
sig1 = 1.0 * sin(2 * pi * f * t) + 0.15 * sin(2 * pi * 4 * f *t);
sig2 = 1.2 * sin(2 * pi * f * t + pi/2) + 0.15 * sin(2 * pi * 3 * f *t);
%
figure;
subplot(3,1,1);
plot(t, sig1, t, sig2);
xlabel('time(s)');
%
x = xcorr( sig1, sig2, 'coeff');
tx = linspace( -t(end), t(end), 2*length(t) -1);
%
subplot(3,1,2);
plot(tx, x);
xlim([-4 4])
xlabel('time(s)');
[foo, ndx] = max( x);
%
%
subplot(3,1,3);
plot(t, sig1, t+tx(ndx), sig2)
xlim([0 10])
xlabel('time(s)');
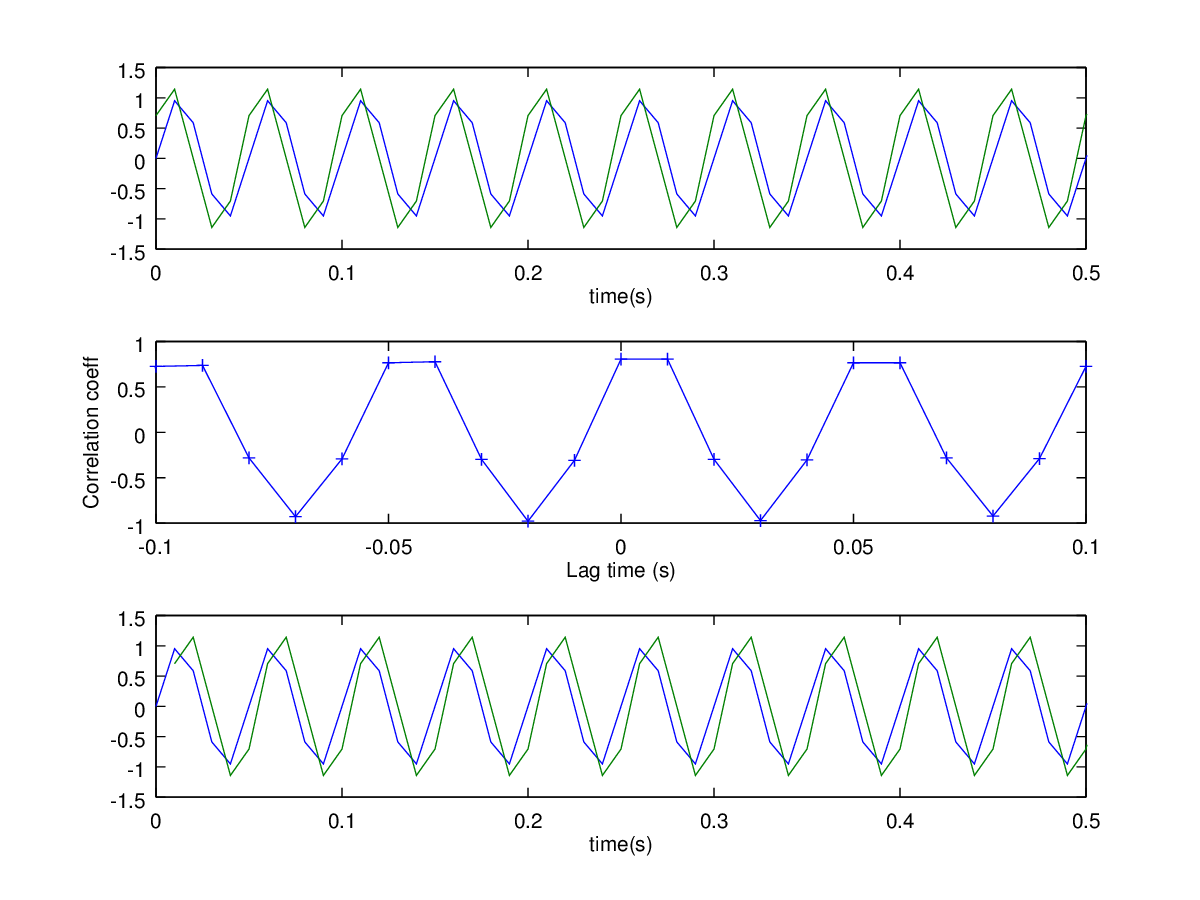
Now, for practical implementation, here is a second example in Figure 11. A code snippet is shown below. The plotting code is mostly the same so it's not repeated. We can see in the top figure that it's essentially the same situation, two periodic signals with a phase shift. The main difference is that the frequency is now 20 Hz instead of 1 Hz. The sampling rate is still 100 Hz. But now, looking at the bottom our code fails to line the time signal up automatically, like it did before. Why did it fail in this case? The answer lies in the middle figure, which is the correlation coefficient. It's been zoomed in so you can see it. The sample rate is 100 Hz and the signal's frequency is 20 Hz. This means that there are only 5 points per cycle. The minimum possible time lag that xcorr can compute is a single sample. In other words, the minimum possible lag that can be computed is 1/5 of a cycle. So our simple code cannot line up the sine waves any closer than 1/5 of a cycle.
To get better resolution, we'd really want a higher sampling rate. That may not be possible. You might be able to use interpolation to increase the sample rate, and thus allow computation of the lags at finer resolution.
Fs = 100;
t = 0:(1/Fs):1;
f = 20;
phase_shift = 36 * pi / 180;
sig1 = 1.0 * sin(2 * pi * f * t);
sig2 = 1.2 * sin(2 * pi * f * t + phase_shift);
x = xcorr( sig1, sig2, 'coeff');
[foo, ndx] = max( x);
time_lag = tx(ndx)